At least once every two years, communities that receive federal funding for homelessness services are required to conduct a Point-in-Time (PIT) Count. This count helps us understand how many people are experiencing sheltered and unsheltered homelessness on a given night across the country.
The 2024 PIT Count
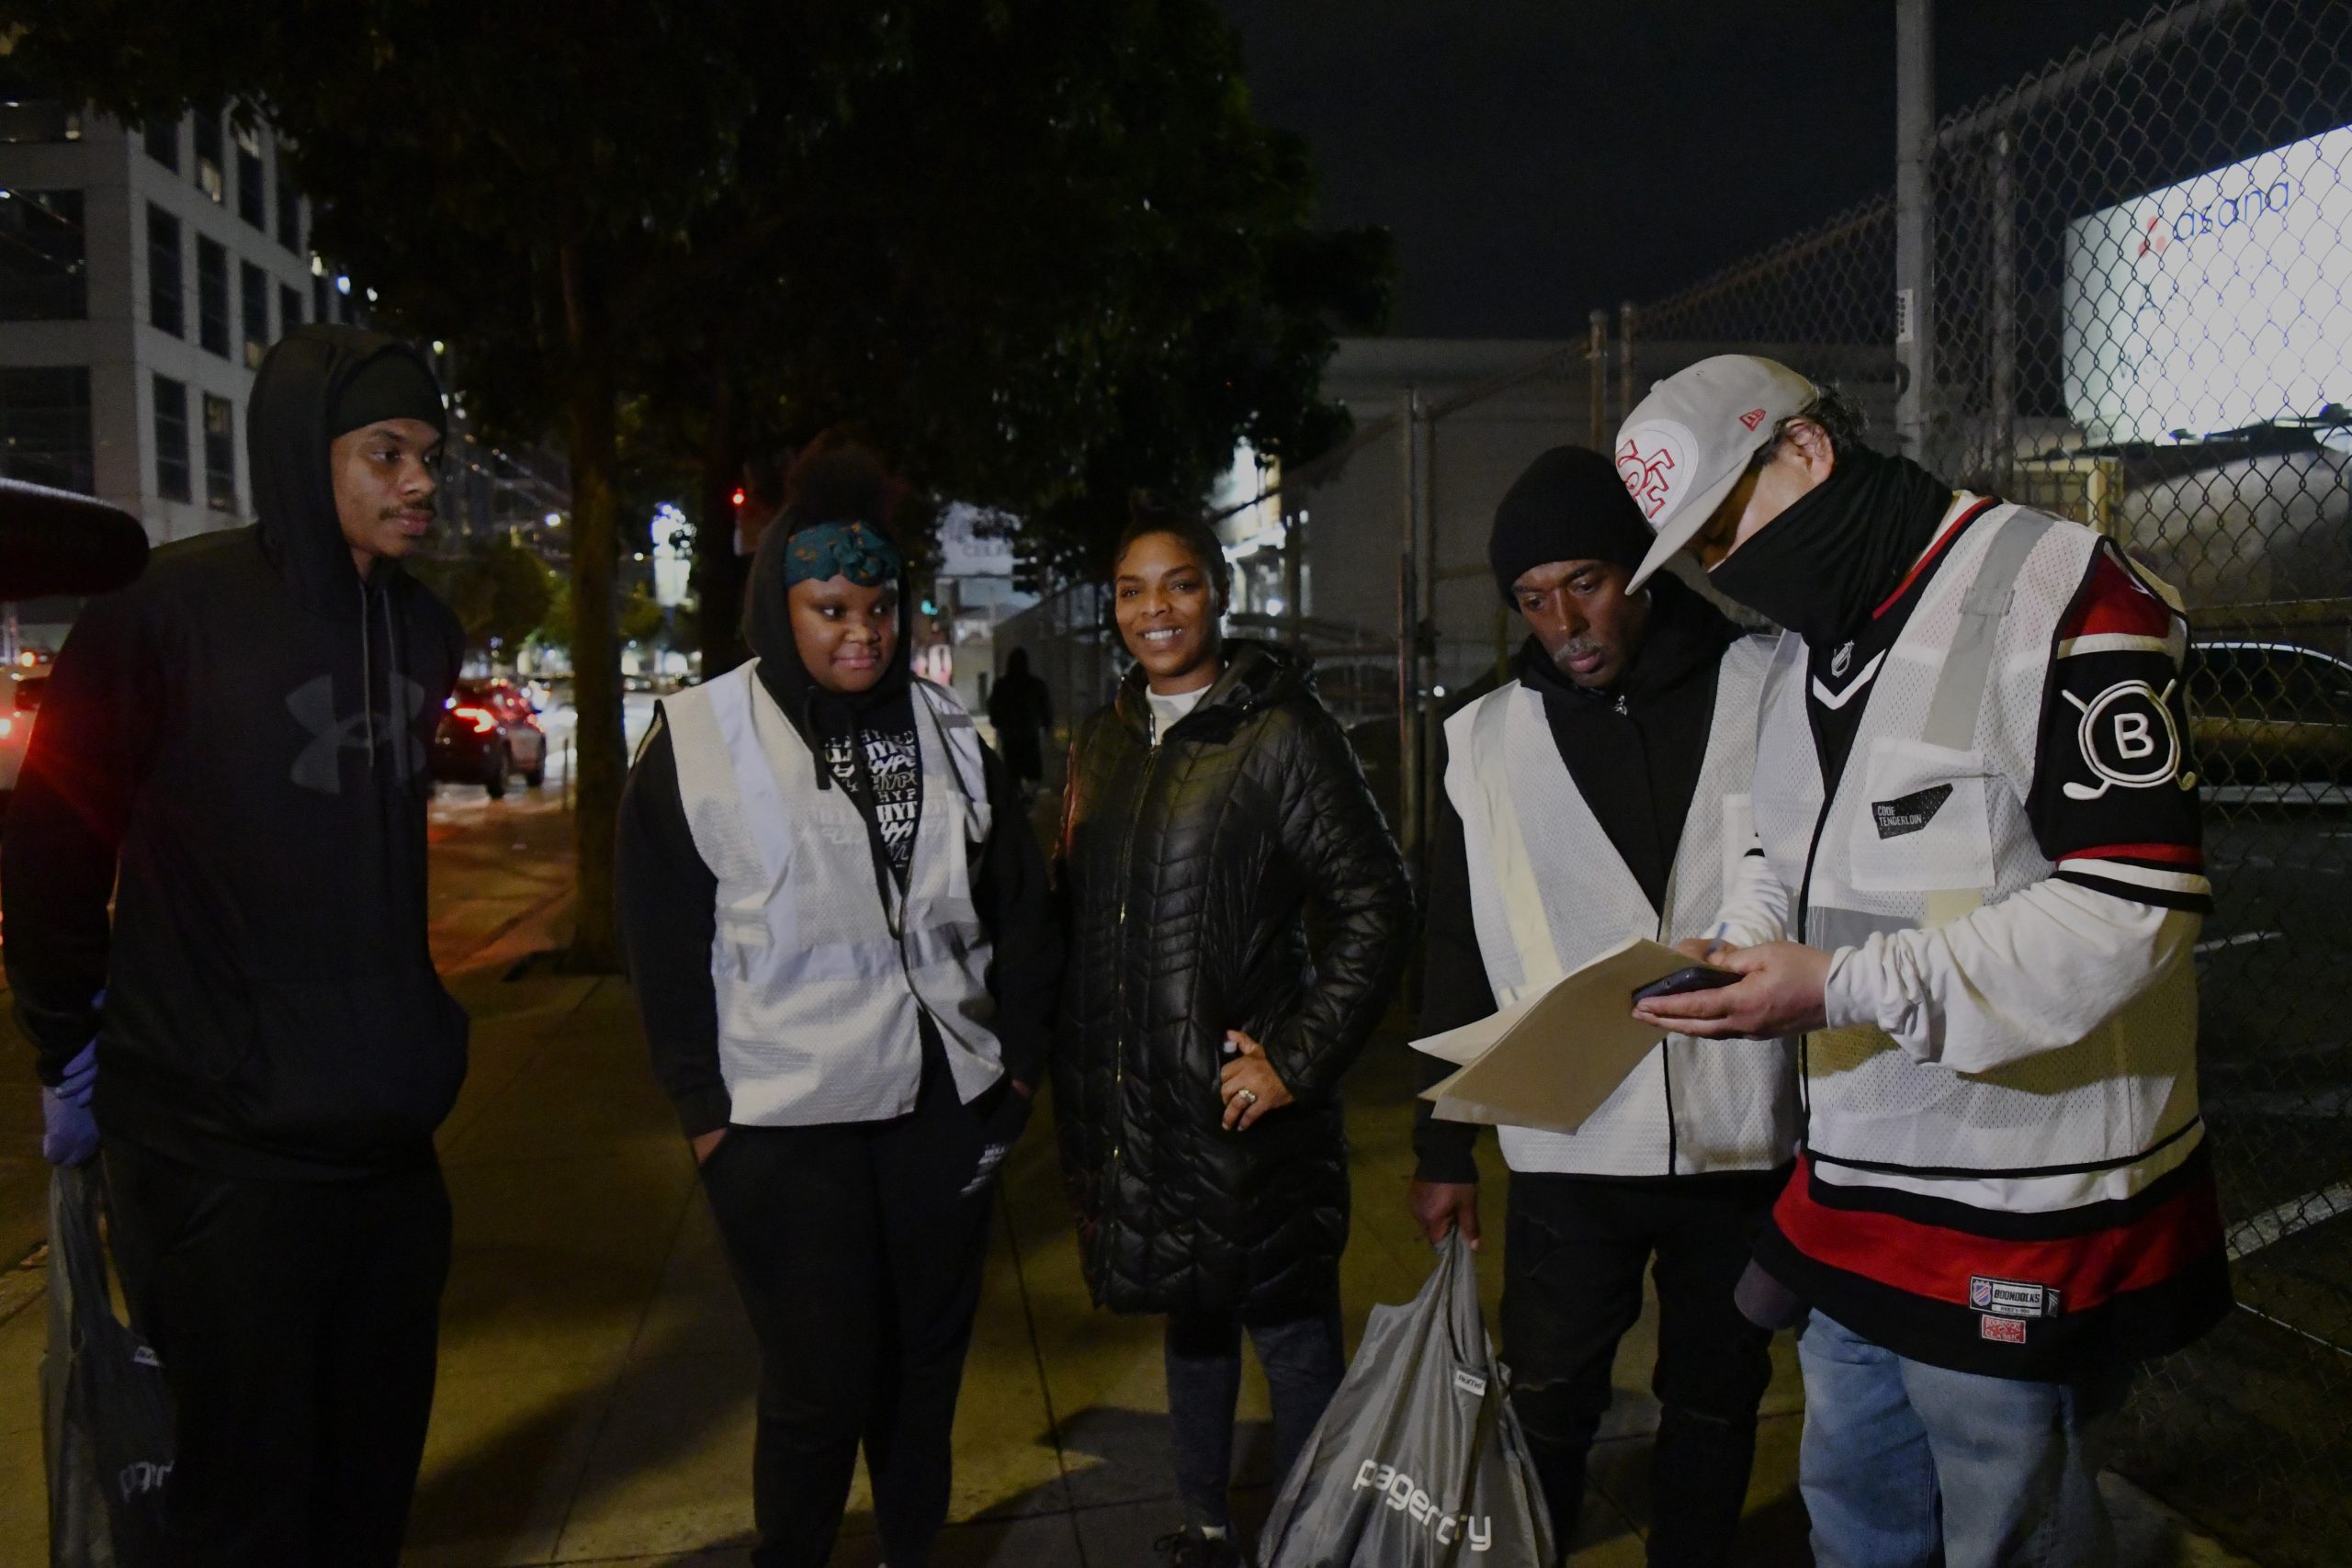
The 2024 Point-in-Time Count took place on January 30, 2024. On that night, teams of skilled outreach workers and volunteers covered the entire city of San Francisco, walking or droving through neighborhoods to count the number of people experiencing unsheltered homelessness – those sleeping on streets, in vehicles, or other places not meant for people to live. HSH also collected data from shelter providers to count the number of people sleeping in emergency shelters, transitional housing, and safe havens on that same night. In February, we administered a survey to gather more detailed information about people experiencing homelessness in San Francisco, including demographic information.
Between the 2022 and 2024 Point-in-Time Counts, HSH helped people exit homelessness at a faster rate than ever before. Over 7,500 clients exited homelessness through permanent supportive housing, rapid re-housing, and housing problem solving interventions including flexible financial assistance and family reunification services. In addition, the City of San Francisco provided emergency financial assistance for over 7,000 households at risk of homelessness through prevention programs.
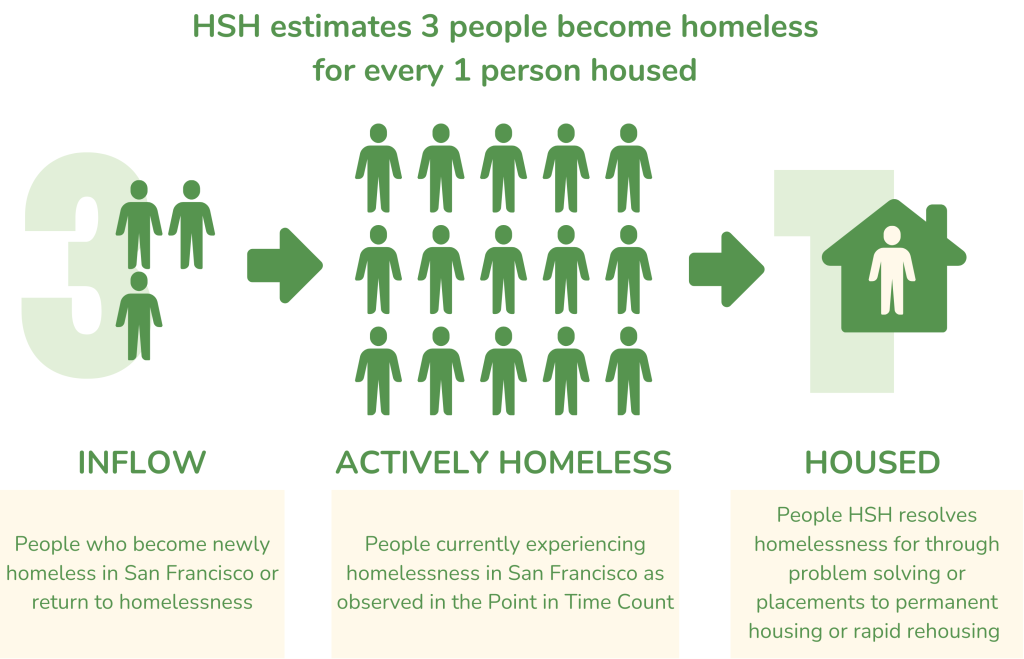
San Francisco continues to experience a high rate of inflow into homelessness. While 8,323 homeless individuals were observed on the night of the PIT Count, more than 20,000 people seek homeless services in San Francisco over the course of a full year. These figures suggest that for every person HSH is able to exit from homelessness through its Homelessness Response System, approximately three people become homeless.
What changed in 2024?
This year we partnered with family service providers to conduct a vehicle count and a phone screen to better identify populations that are especially challenging to count accurately.
- Teams canvased high density areas in the early morning following the PIT count to better identify people who appear to be living in their vehicles. This year, we identified 393 more people staying in vehicles than in 2022.
- Family access point staff called unsheltered families that were active in the homeless response system and confirmed their living situation. This year, we identified 200 more families experiencing homelessness than in 2022.
Why Does the PIT Count Matter?
The PIT Count helps us understand the size and characteristics of the homeless population. Since PIT Count have been conducted similarly nationwide since 2005, the data can help us monitor our progress towards ending homelessness over time and can be compared with other communities nationwide. The data is essential for planning services and programs to meet local needs and helps inform strategic planning. Additionally, the PIT Count meets our reporting requirements as a U.S. Department of Housing and Urban Development (HUD) grantee and can impact the federal funding we receive.
Scroll down for information about the 2024 Point-in-Time Count.
2024 Point-in-Time Count
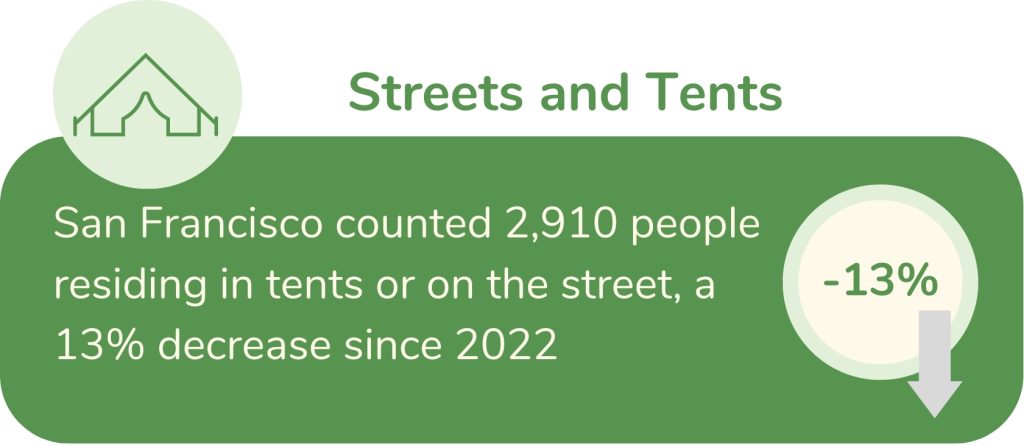
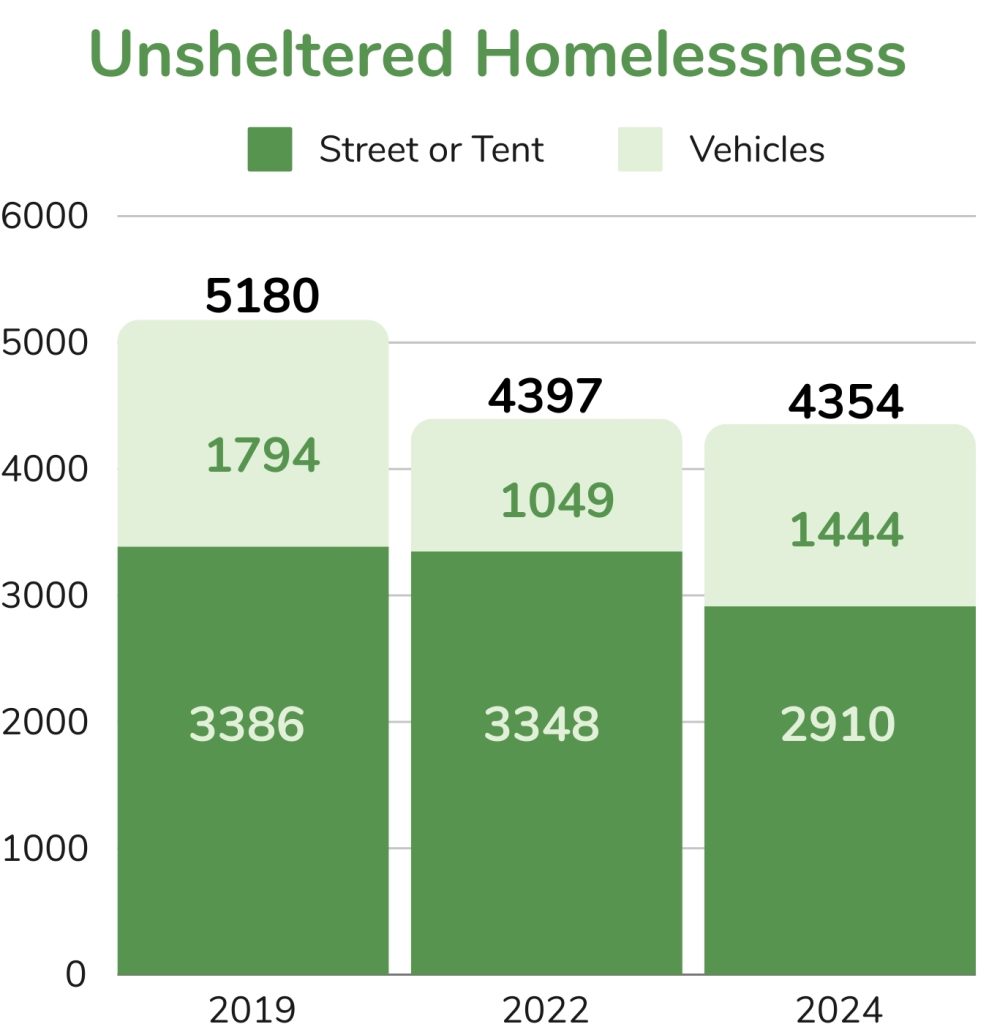
The 2024 PIT Count found that 13% fewer people were sleeping on the streets or in tents than in 2022, the lowest it has been in ten years.
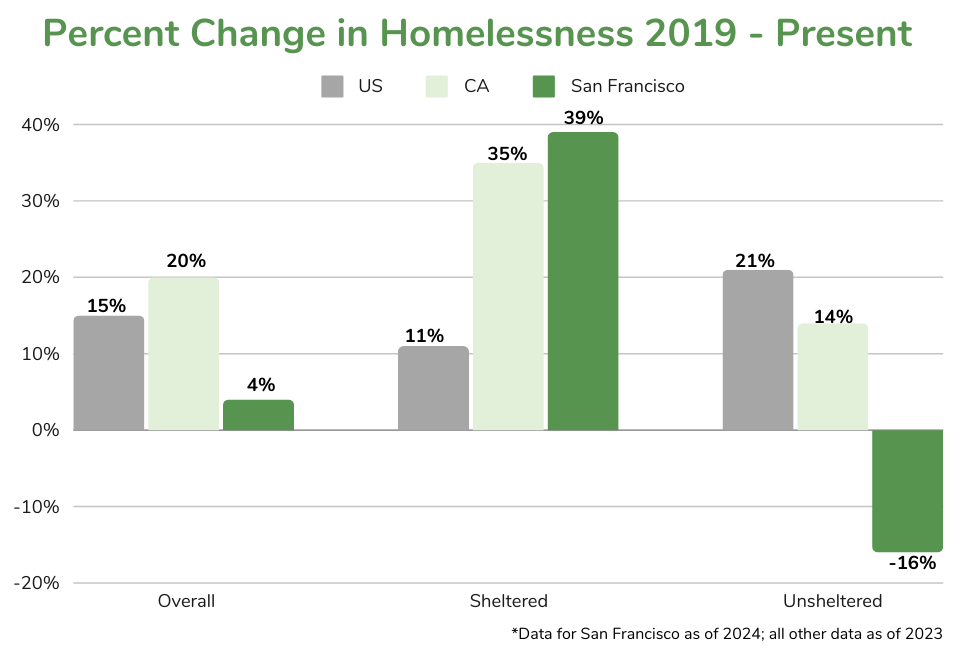
4,354 unsheltered people were counted, a 1% decrease since 2022 and a 16% decrease since 2019.
The number of people living in vehicles increased 37% from 2022, but decreased 20% since 2019.
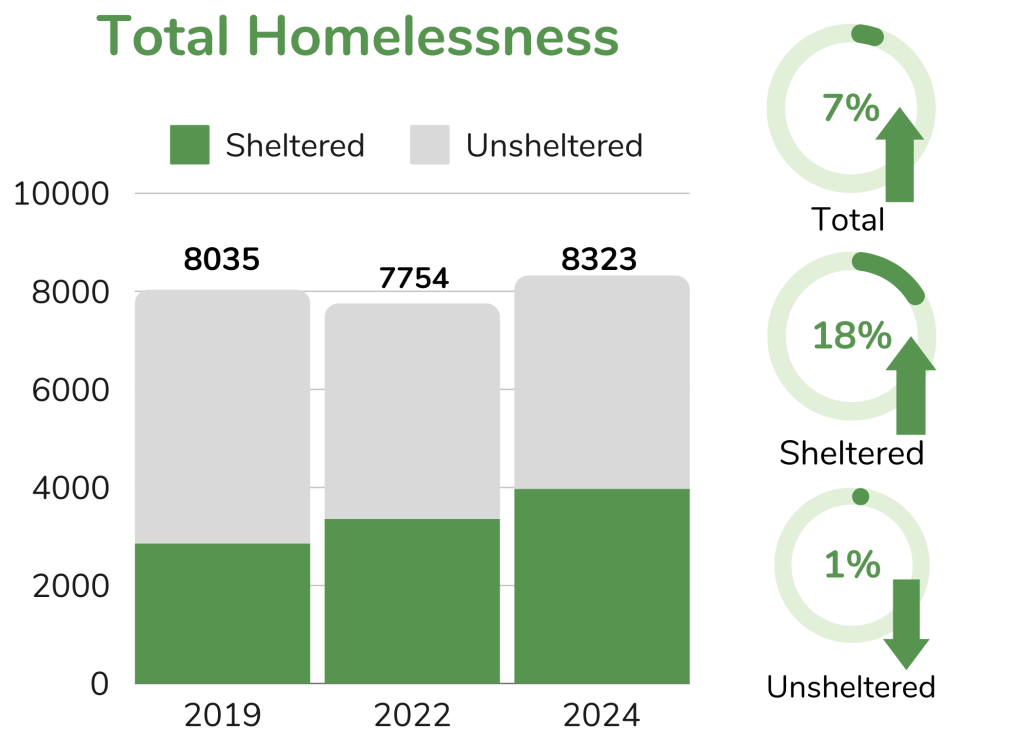
Total homelessness (combining sheltered and unsheltered people) increased by 7% since 2022 from 7,754 to 8,323 people.
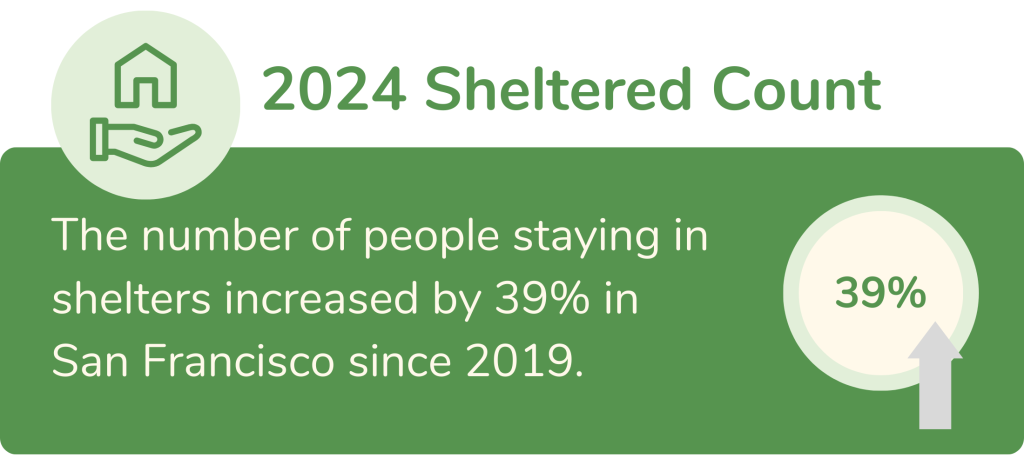
3,969 people were living in shelters the night of the 2024 PIT Count. This is a 39% increase since 2019.
This corresponds with a 28% increase in available shelter beds since 2019.
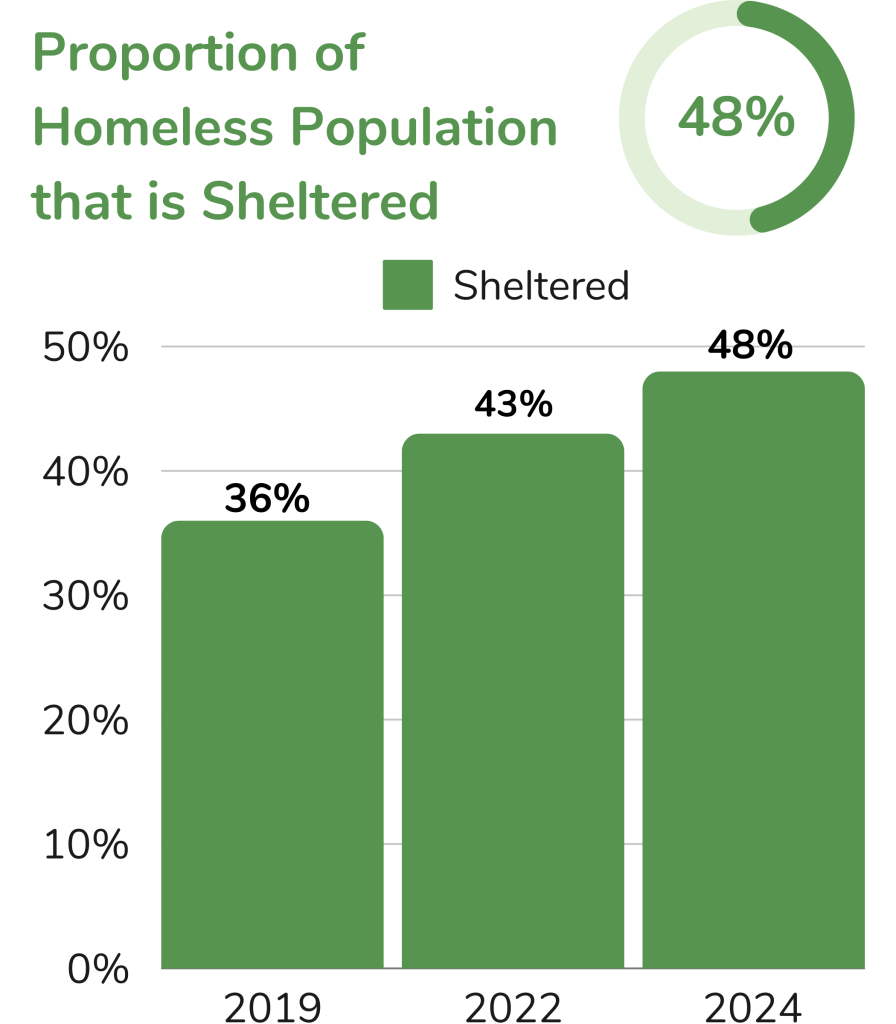
More people experiencing homelessness in San Francisco are in shelter than ever before.
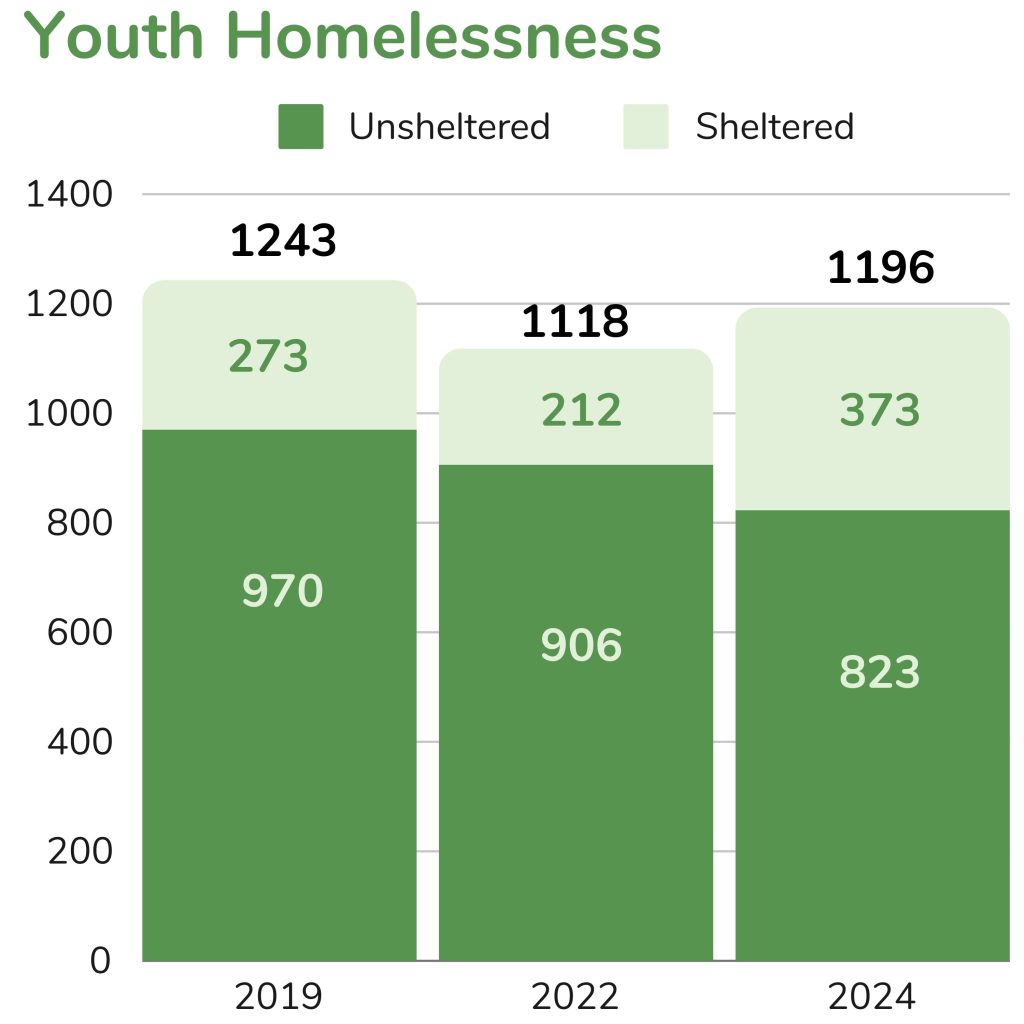
Homeless youth are unaccompanied minors under 18 years old and young adults age 18-24.
The unsheltered homeless youth population decreased 9% between 2022 and 2024.
The number of sheltered homeless youth increased 76% between 2022 and 2024. This reflects an increase in shelter capacity and an increase in shelter utilization. Youth are more likely to be sheltered than ever before.
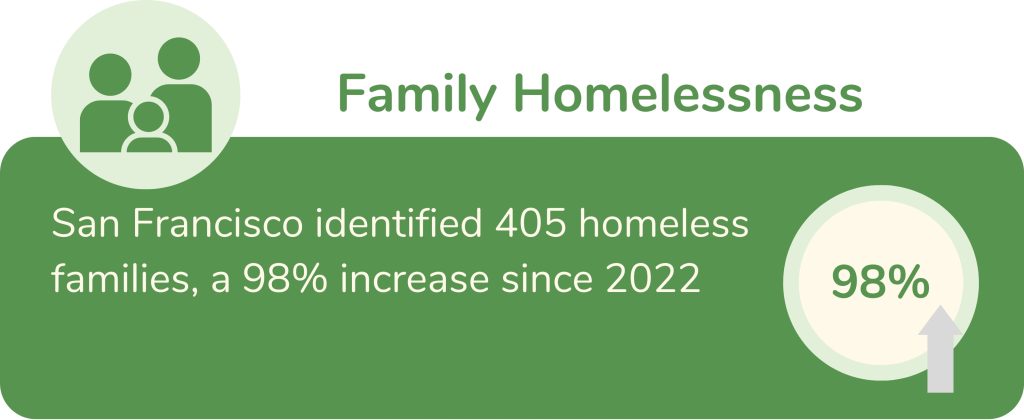
New targeted efforts to better identify homeless families were introduced in 2024. 405 homeless families were counted, a significant increase from prior years.
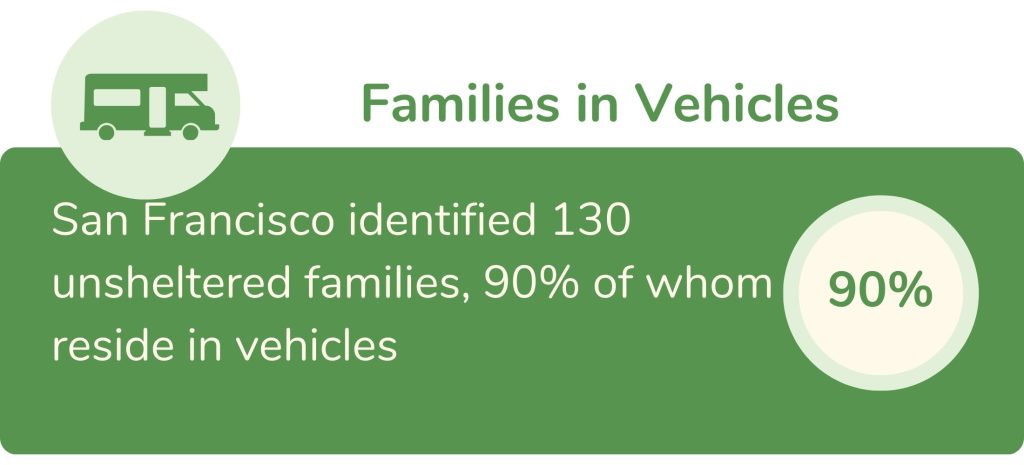
130 families were experiencing unsheltered homelessness, 90% of whom were found to be sleeping in vehicles.
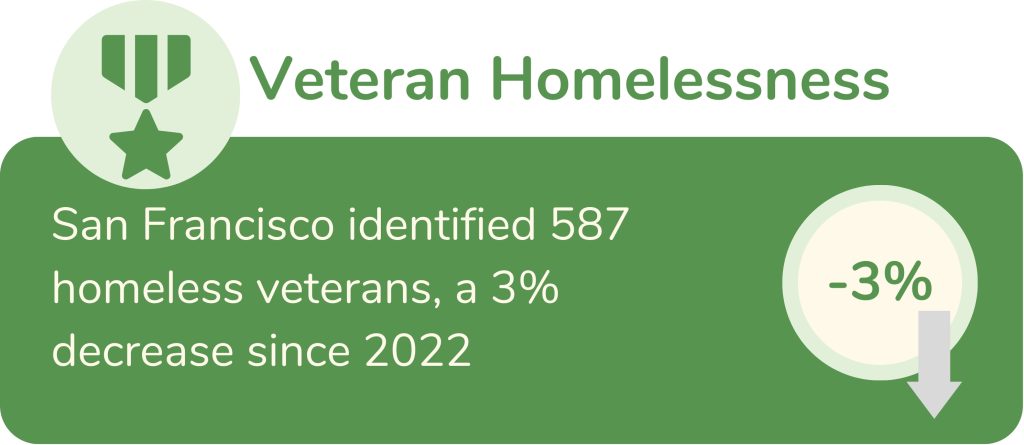
The total number of homeless veterans decreased by 3%, with 605 homeless veterans in 2022 and 587 homeless veterans in 2024.
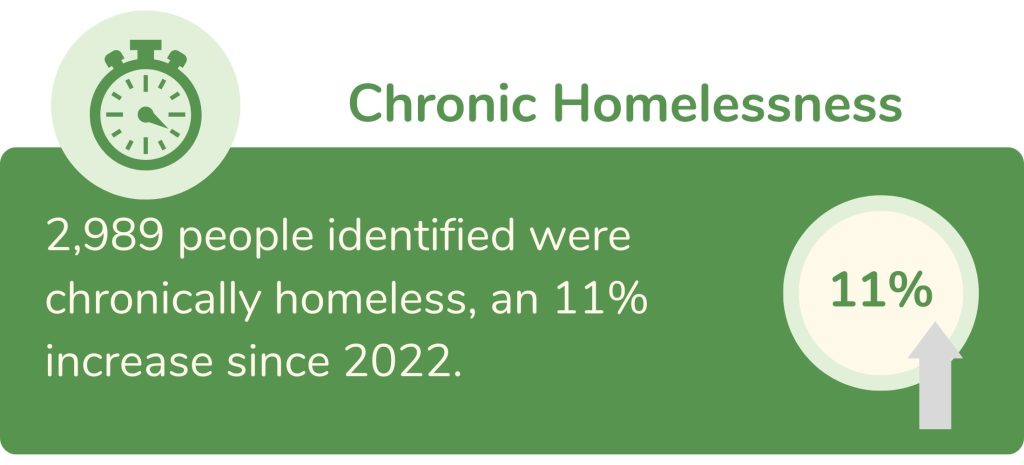
Between 2022 and 2024, chronic homelessness increased by 11% with 2,989 people experiencing chronic homelessness in 2024. Thirty-five percent of the total homeless population is chronically homeless, a rate similar to 2022.
In the past five years, homelessness increased 4% in San Francisco. In a similar time period (2019-2023), homelessness increased 15% nationally and 20% in California.
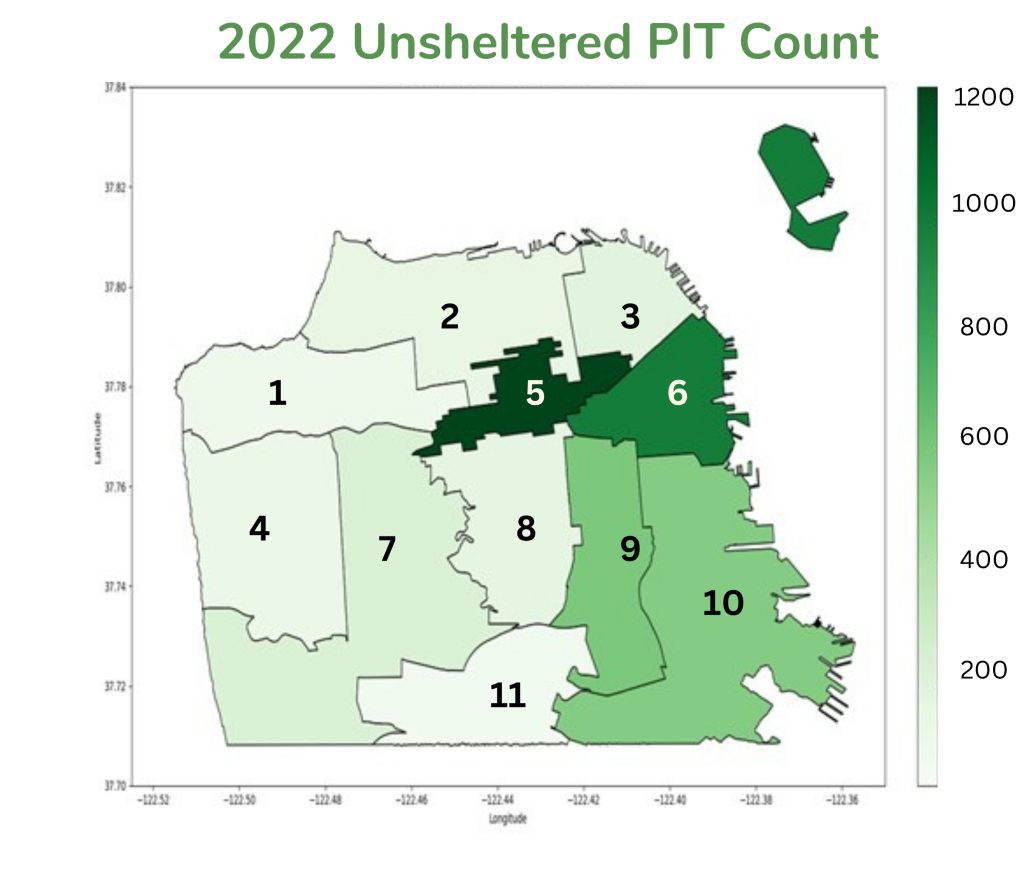
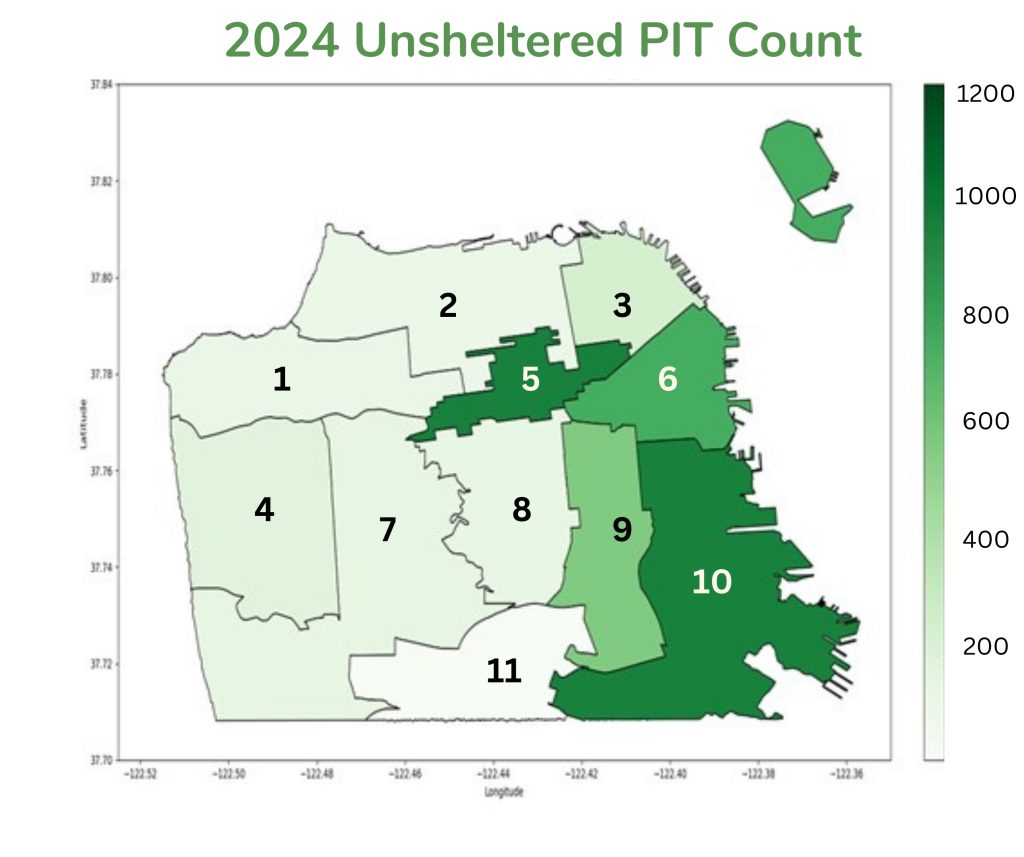
District 5 and 6 saw a 20% and 23% decrease in unsheltered homelessness respectively. District 10 saw a 78% increase in unsheltered homelessness between 2022 and 2024, largely due to an increase in people living in vehicles.
PIT Demographics
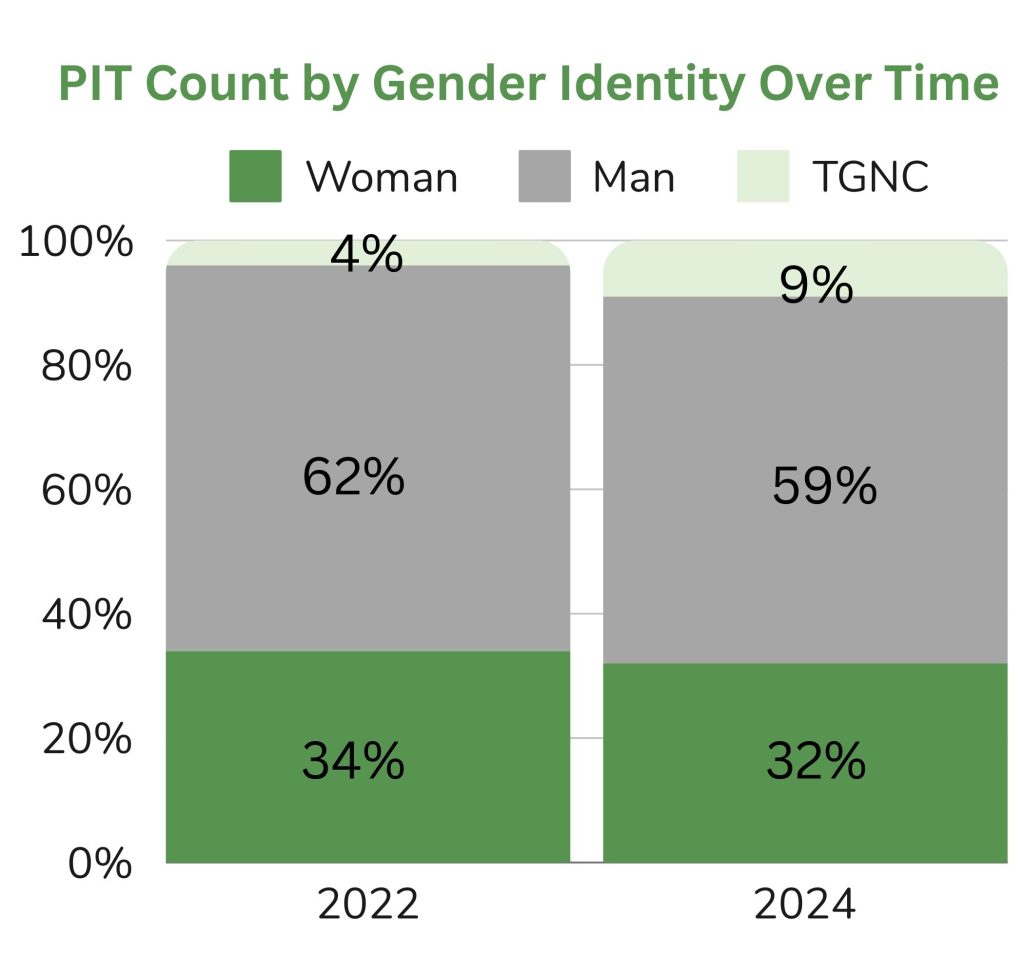
In 2024, 9% of the homeless population identifies as Transgender or Gender non-conforming (TGNC), up from 4% in 2022.
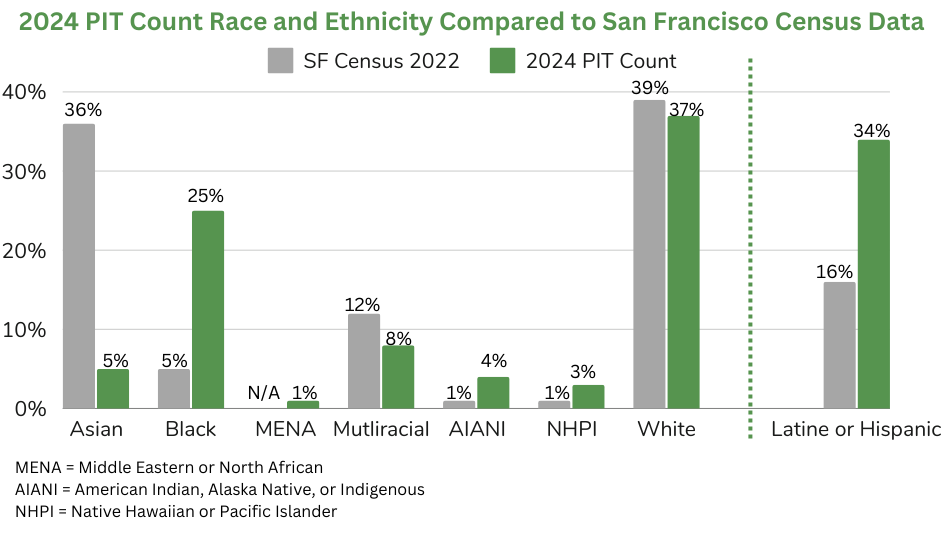
This year, 34% of people (2,820 people) experiencing homelessness identified as Hispanic or Latine up from 30% in 2022.
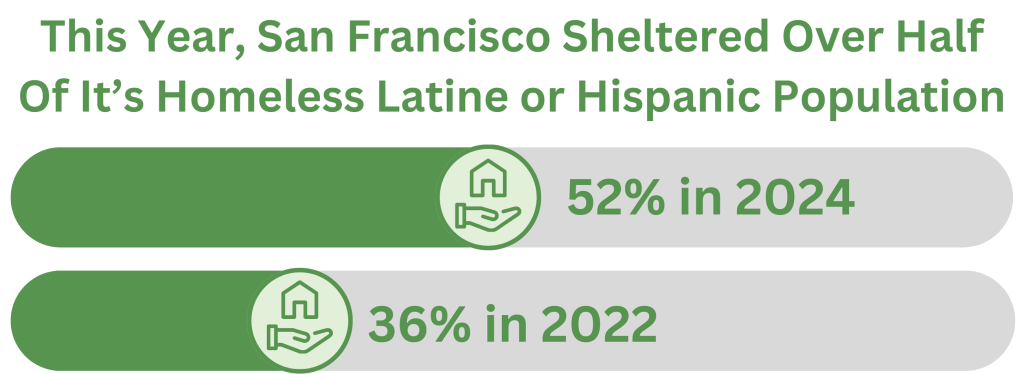
San Francisco sheltered over half of its Hispanic or Latine population, 52% of the Hispanic or Latine population were in shelters on the night of the PIT count up from 36% in 2022.
People who identify as Asian or Asian American remain underrepresented in the Homeless population.
People who identify as Black, African American or African or who identify as Hispanic or Latine are overrepresented in the homeless population.
PIT Survey Results
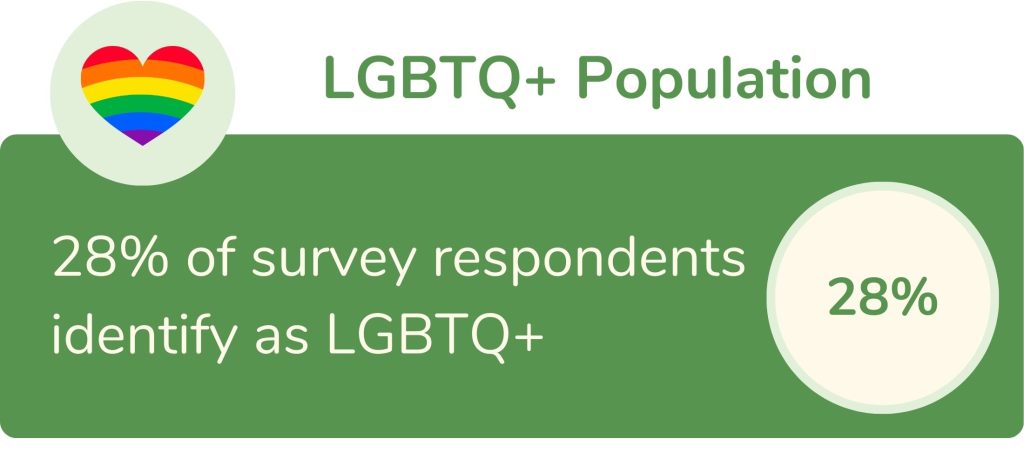
28% of survey respondents identify as LGBTQ+. This is not a significant change from prior years.
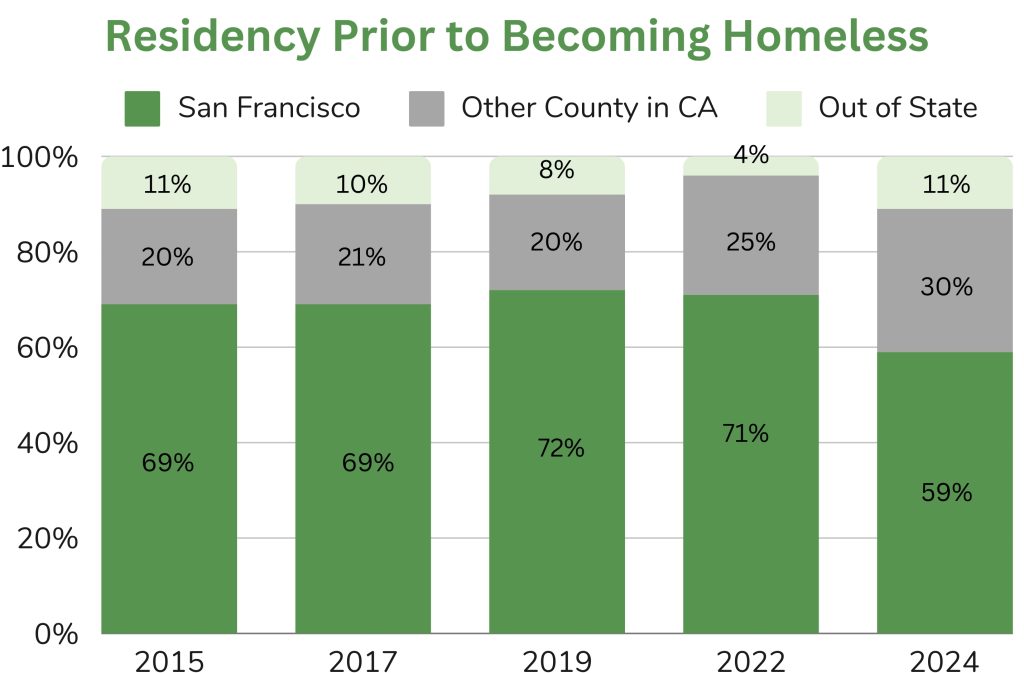
59% of respondents said that they were last housed in San Francisco. In 2024, more people indicated they became homeless while living in another California county than in prior years.
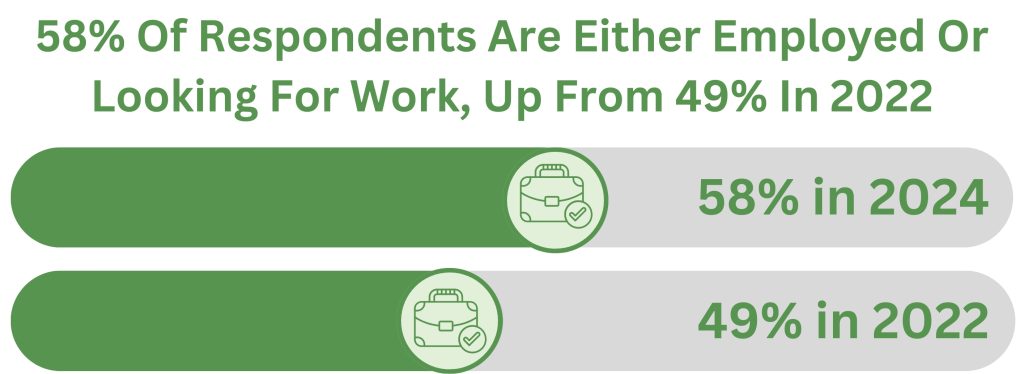
More people are employed or looking for work this year, at 58% of respondents in 2024 compared to 49% in 2022.
Youth Survey Results
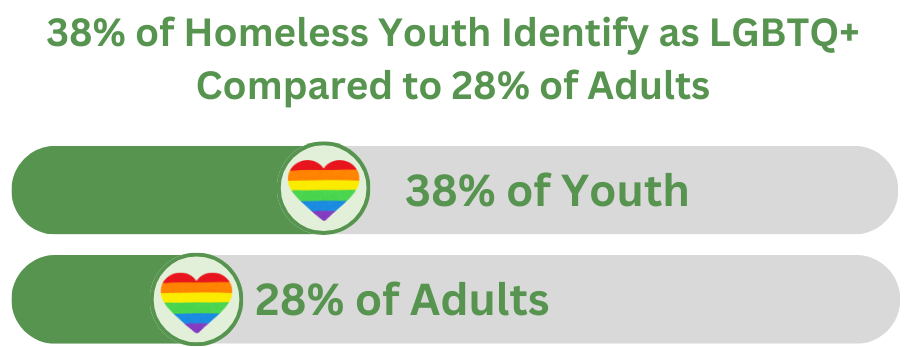
Homeless youth are more likely than adults to identify as LGBTQ+. 38% of homeless youth identify as LGBTQ+ this is up from 33% in 2022.
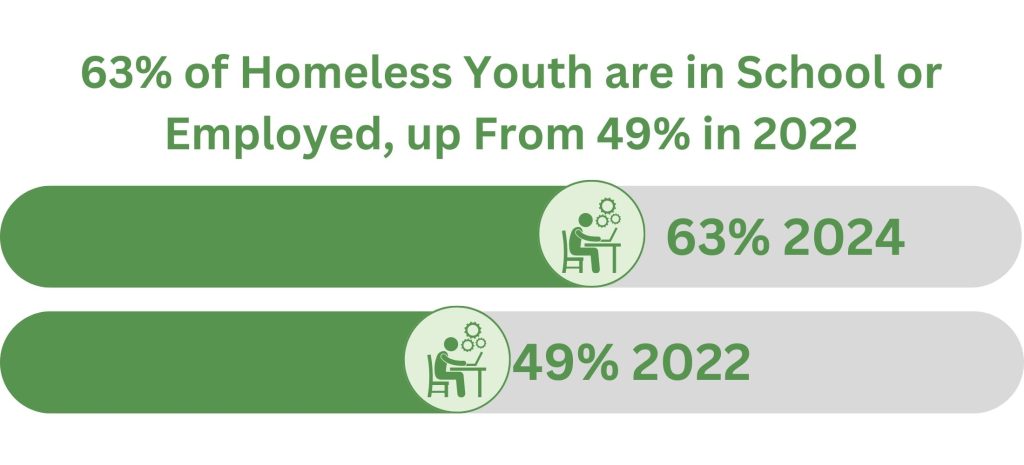
63% of homeless youth are in school or employed, up from 49% in 2022. 28% of youth are employed, that’s up from 22% in 2022.
PIT Count Data Dashboard
The dashboard below includes data from unsheltered and sheltered PIT Counts as reported to HUD annually. Sheltered counts are conducted every year and unsheltered counts are conducted once every other year. Due to the COVID-19 pandemic, San Francisco did not conduct an unsheltered count in 2021.
The dashboard also contains two sets of supplemental data that provide additional information on the scope of homelessness in San Francisco for populations not included in HUD’s PIT Count guidelines. One set of supplemental data counts individuals sleeping in jails, hospitals, or residential treatment facilities on the night of the PIT Count who are otherwise unhoused. In addition, supplemental data from San Francisco Unified School District (SFUSD) counts students who lack fixed, regular, and adequate housing. SFUSD data is collected as of October 2023 and includes children “doubled-up” or staying in hotels and motels, which are excluded from the PIT Count per HUD’s guidelines.
PIT Survey Dashboard
The dashboard below includes data from PIT surveys conducted following each PIT count. PIT surveys are used to estimate the demographic and household characteristics of the unsheltered population as necessary for federal reporting. The surveys also help us understand key characteristics about the unhoused population that can be used for planning and program design.
Surveys were conducted by trained outreach workers and peer surveyors. In 2024, 956 surveys were completed and validated, including 120 surveys administered to youth.
Youth Survey Dashboard
The dashboard below includes data from the youth supplemental survey conducted as part of the PIT Survey process. The youth supplemental survey was developed and administered with input and support from youth providers and elicits key insights into the needs of San Francisco’s unhoused people aged 24 and under. In 2024, 120 youth supplemental surveys were completed and validated.